I began this journey convinced that Steampipe could help the fediverse evolve, but not sure exactly how. My first thought was to use Steampipe’s API-wrangling superpower to study patterns of communication (and conflict) across the fediverse. But as one of many Twitter escapees last November, I soon realized that the network I was joining reflected a culture that had been humming along nicely for six years and didn’t particularly want to be the object of sociological study.
As I argued in Autonomy, packet size, friction, fanout, and velocity, Mastodon bakes in certain kinds of friction for reasons. You’ve likely heard about a default unfriendliness to search, which is both a technical setting and a cultural choice that privileges the experience of current flow over the mining of past flow. Even more fundamentally, the ID of a toot not only differs from server to server but also obfuscates the toot’s date, another technical/cultural choice that means you can’t randomly access history by date. None of these frictions is insurmountable. They will be overcome for purposes good and bad. I hope and expect that communities will be able to choose their desired amounts and kinds of friction while still interoperating with others. But for my project it seemed that trying to survey the wider fediverse wasn’t the right place to start.
So instead I began to explore a different way to read my home timeline. The dashboards that I’ve built and described in this series have become, for me at least, an effective way to scan recent Mastodon flow, then click into the stock client to post, reply, or boost. After overcoming a few obstacles, things are starting to feel like the Bloomberg terminal for Mastodon that I envision.
One of those obstacles was the awkward copy/paste/search of foreign toot URLs that was required in order to interact with them. That’s now overcome by Instance-qualified Mastodon URLs. Another obstacle was the difficulty of curating and effectively reading topical lists of people. The strategies described in Lists and people on Mastodon and Working with Mastodon lists have improved matters nicely. And relationship graphs turned out to be a more useful alternate view of the current flow than I had expected.
I think I’ve proven that a set of Steampipe dashboards, layered on a plugin that maps the Mastodon API to tables that the dashboards query, can improve the ability to absorb and react to Mastodon flow. An unproven corollary: Steampipe’s dashboards-as-code system is only one of potentially many clients of the Mastodon plugin. Any dashboarding system or web app or native app could tap into the same query capability to deliver still another way to experience the flow. But that’s a future episode.
Meanwhile, with a decent reading experience in place, this seemed like a good time to circle back to the question of surveying the wider fediverse. To begin enabling that I added a couple of new tables to the plugin: mastodon_peer and mastodon_domain_block.
Here’s a query that uses mastodon_peer.
with data as ( select ‘https://’ || server as server from mastodon_toot where timeline = ‘home’ limit 100 ), servers as ( select server, count(*) as occurrences from data group by server ) select s.server, s.occurrences, count(p.peer) as peers from servers s join mastodon_peer p on s.server = p.server group by s.server, s.occurrences order by peers desc
In Engish: Gather the most recent 100 toots in my home timeline, count the occurrences of each origin server, then ask each origin server how many other servers it talks to. Unsurprisingly my home server, mastodon.social, occurs most often. And because it’s the marquee Mastodon server it has the most peers.
+———————————-+————-+——-+ | server | occurrences | peers | +———————————-+————-+——-+ | https://mastodon.social | 11 | 49732 | | https://fosstodon.org | 1 | 33973 | | https://octodon.social | 1 | 29983 | | https://infosec.exchange | 2 | 26833 | | https://indieweb.social | 9 | 26279 | | https://hachyderm.io | 3 | 19911 | | https://social.treehouse.systems | 3 | 18110 | | https://journa.host | 1 | 18021 | | https://nerdculture.de | 9 | 17984 | | https://werd.social | 2 | 13792 | | https://dan.mastohon.com | 2 | 13351 | | https://masto.nyc | 1 | 10917 | | https://mastodon.archive.org | 1 | 9582 | | https://social.fossdle.org | 1 | 8343 | | https://devdilettante.com | 12 | 6898 | +———————————-+————-+——-+
Here’s a query that uses mastodon_domain_block.
with data as ( select ‘https://’ || server as server from mastodon_toot where timeline = ‘home’ limit 100 ), servers as ( select server, count(*) as occurrences from data group by server ) select s.server, s.occurrences, count(d.domain) as “blocked domains” from servers s join mastodon_domain_block d on s.server = d.server group by s.server, s.occurrences order by “blocked domains” desc
This one says: Again gather the origin servers in my recent home timeline, but this time ask each one how many other servers it blocks. Here we see that octodon.social, which happened to show up in my timeline when I ran the query, blocks a lot more servers than mastodon.social does.
+————————–+————-+—————–+ | server | occurrences | blocked domains | +————————–+————-+—————–+ | https://octodon.social | 1 | 510 | | https://mastodon.social | 8 | 181 | | https://hachyderm.io | 4 | 125 | | https://infosec.exchange | 4 | 66 | | https://nerdculture.de | 1 | 36 | | https://indieweb.social | 4 | 23 | +————————–+————-+—————–+
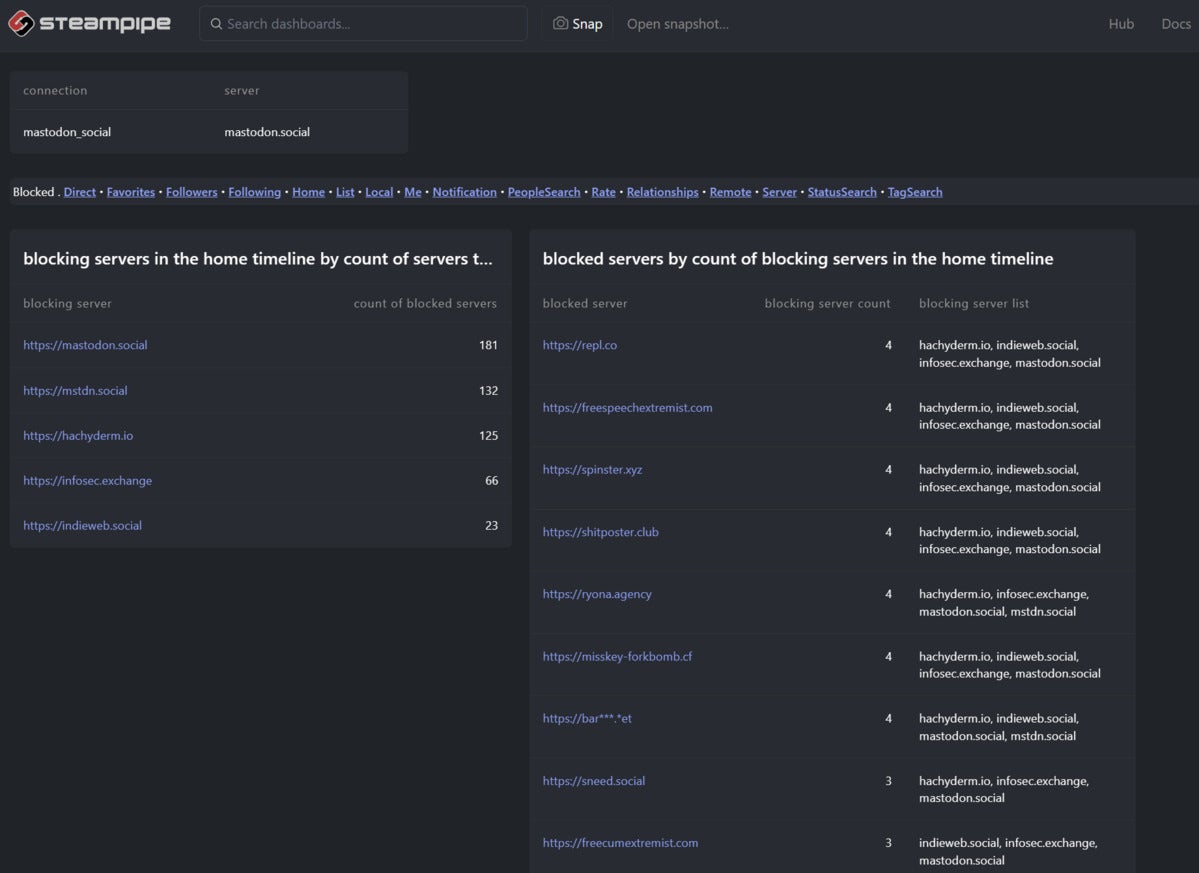
One could, and maybe at some point I will, comprehensively acquire and store this data. But meanwhile, how might it enhance the experience of reading recent Mastodon flow? Here’s what I’ve got so far.
 IDG
IDG
We’ve already seen the first table which answers the question: “How many servers does each of the origin servers in my timeline block?” The second table answers a different question: “Which servers are most often blocked by the origin servers in my timeline?”
The blocking server list column shows an interesting mix of consensus and variation, and I think that will be something to explore comprehensively across the fediverse. But for now I like how this view contextualizes what’s in my home timeline. Like the relationship graphs, it’s highly dynamic because my immediate network neighborhood is changing all the time. Whatever the current set of servers happens to be, though, I now have some clues about how connected each of those servers is and how aggressively each one is blocking others. This feels like a good first step toward mapping the wider fediverse.
This series:
- Autonomy, packet size, friction, fanout, and velocity
- Build a Mastodon dashboard with Steampipe
- Browsing the fediverse
- A Bloomberg terminal for Mastodon
- Create your own Mastodon UX
- Lists and people on Mastodon
- How many people in my Mastodon feed also tweeted today?
- Instance-qualified Mastodon URLs
- Mastodon relationship graphs
- Working with Mastodon lists
- Images considered harmful (sometimes)
- Mapping the wider fediverse
Copyright © 2023 IDG Communications, Inc.
Originally posted on February 8, 2023 @ 12:00 pm